The problem
Heterogeneous catalysis datasets are small, expensive, and unevenly measured. Teams need more data than they can afford to generate, but synthetic rows are only useful if their fidelity is measured and their limits are visible.
The modelling layer has the same problem: a black-box prediction is hard to defend in a paper or a lab meeting. Interpretability is not a bonus here; it is how a chemist decides whether to run the next experiment.
What I built
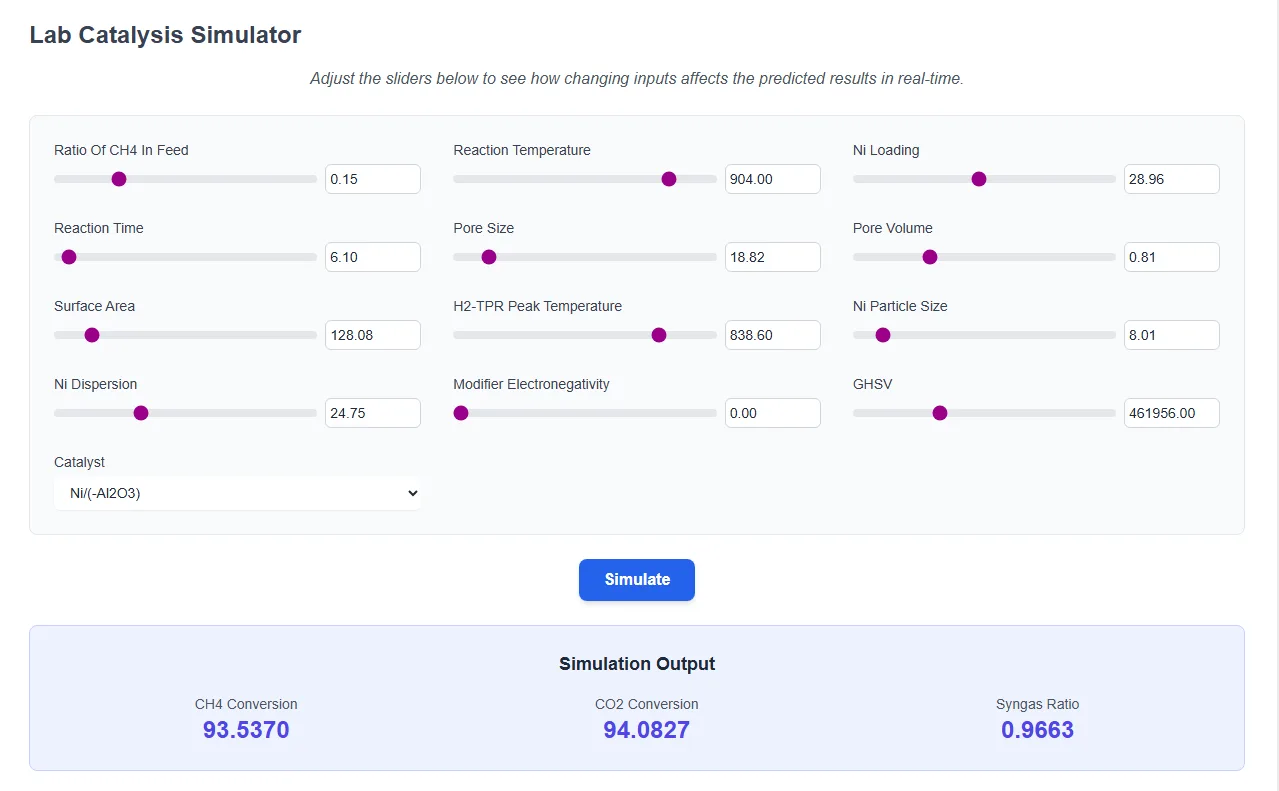
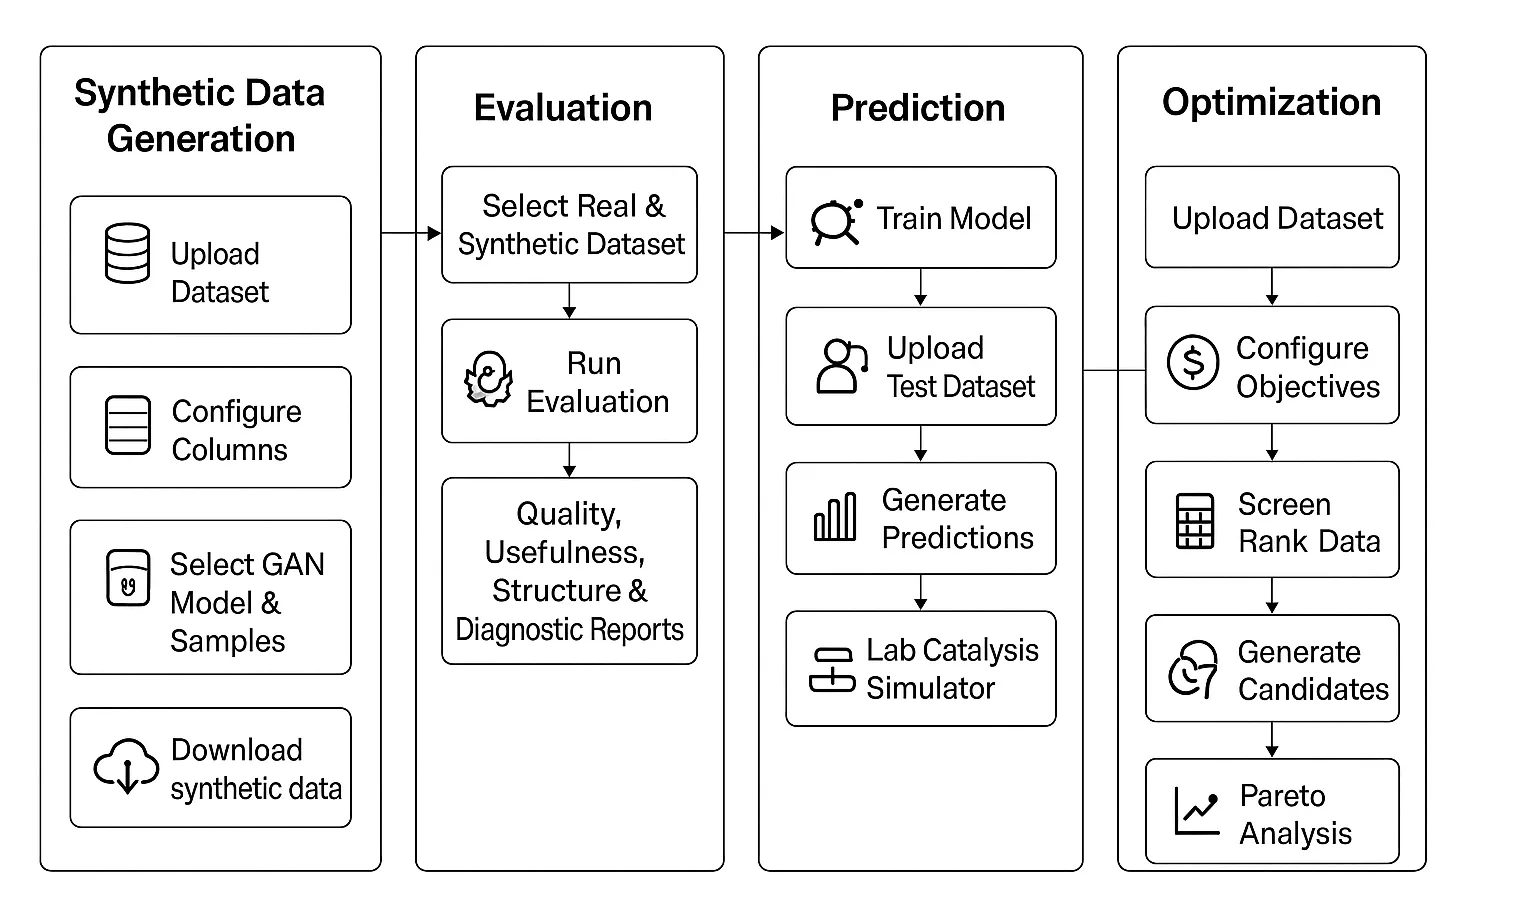
CatForge is a browser platform for that workflow: upload and curate a dataset, generate physically plausible synthetic rows, evaluate their fidelity, train interpretable predictors, and optimize candidates against cost and performance.
- Synthetic data generation: Gaussian Copula, CopulaGAN, and CTGAN with seeded, column-role-aware generation.
- Evaluation: KS/TV similarity, correlation preservation, missing-value similarity, detectability, and conditional ML efficacy.
- Prediction: auto-tuned XGBoost/RF ensembles, RFE/PLS, SHAP/LIME explanations, and what-if analysis.
- Optimization: hybrid local-elite mutation plus Bayesian Optuna search, Pareto and TOPSIS ranking, TEA cost ranking, and active learning.
- Product: the full eight-stage workflow, roles, admin tooling, usage limits, audit logging, and a Flask/React deployment.
What the results showed
The system paper evaluated four datasets from 10 to 1,831 rows. Aggregate synthetic fidelity was 71.8–78.2%, with per-target R² ranging from 0.996 to −0.23 — reported as-is, not cherry-picked.
In three matched-condition lab comparisons, predicted conversions agreed with experiments to within 0.3–6.8 percentage points, while the syngas ratio missed by up to 0.38. The platform has 52 automated tests and is live at catforge.qcri.org.
What I learned
Synthetic data is a tool, not a substitute for measurement. The moment the platform reported fidelity and failure cases together, researchers trusted it more, not less.
Interpretability carried the workflow. SHAP/LIME made the model useful in a conversation with a domain scientist; without that layer, the numbers were just numbers.